For every serious investor, a moment of truth arrives when it’s time to choose:
Do you hold on to a flagging asset? Or cut your losses and make a swift shift into a more stable asset?
For those tracking the US dollar, this may be one of those moments. Because right now, despite official evidence to the contrary, the news media is frothing with headlines touting the dollar’s strength.
The Wall Street Journal says, “…the strong dollar continues to take a toll on earnings.”
AP News says, “Soaring US dollar spreads pain worldwide.” And “[t]he dollar is up 18% this year and last month hit a 20-year high…”
Bloomberg says, “The US dollar gained against nearly all its major peers as trading kicked off in 2023 after a seasonal holiday lull.”
And Treasury Secretary Janet Yellen says, “…many countries are concerned with the spillovers from US policy on their exchange rates with the dollar being so strong.”
So, at face value, it sure looks like America’s currency is still “King Dollar.” But behind the scenes, in the cold light of the Fed’s official numbers, a different story appears.
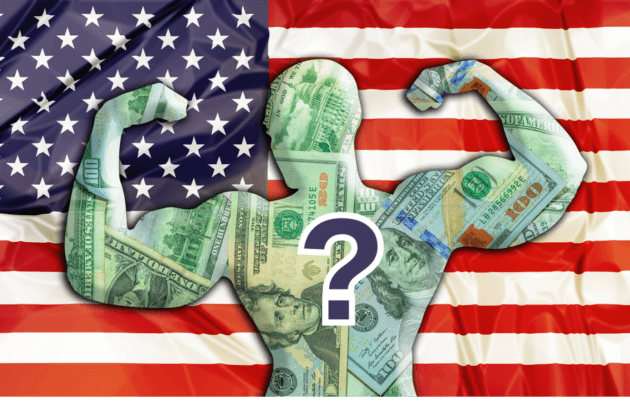
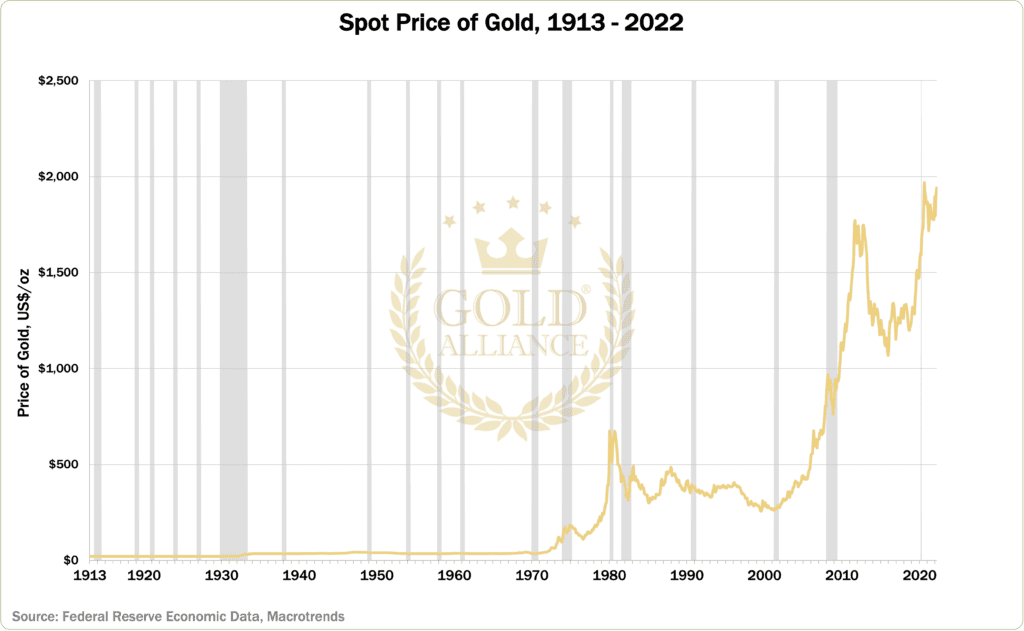
First, look at this line:
If this were an asset you owned, would you hold on for a while longer? Or would you wonder if it’s best to choose another asset?
What if the line stood for your retirement savings? Would you shift into an asset on the rise?
Now, look at this line:
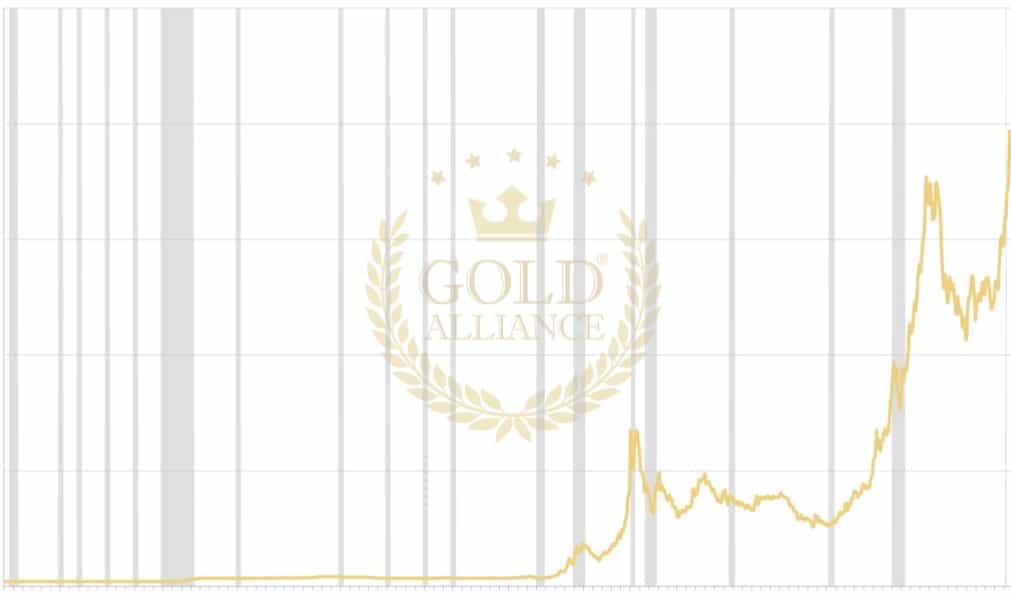
With rare exceptions, this asset’s value has risen for more than 100 years running.
If this were an asset you owned, would you feel encouraged?
If you didn’t own this asset, would you consider buying it now?
Now, look at the eye-opening chart of the two lines together:
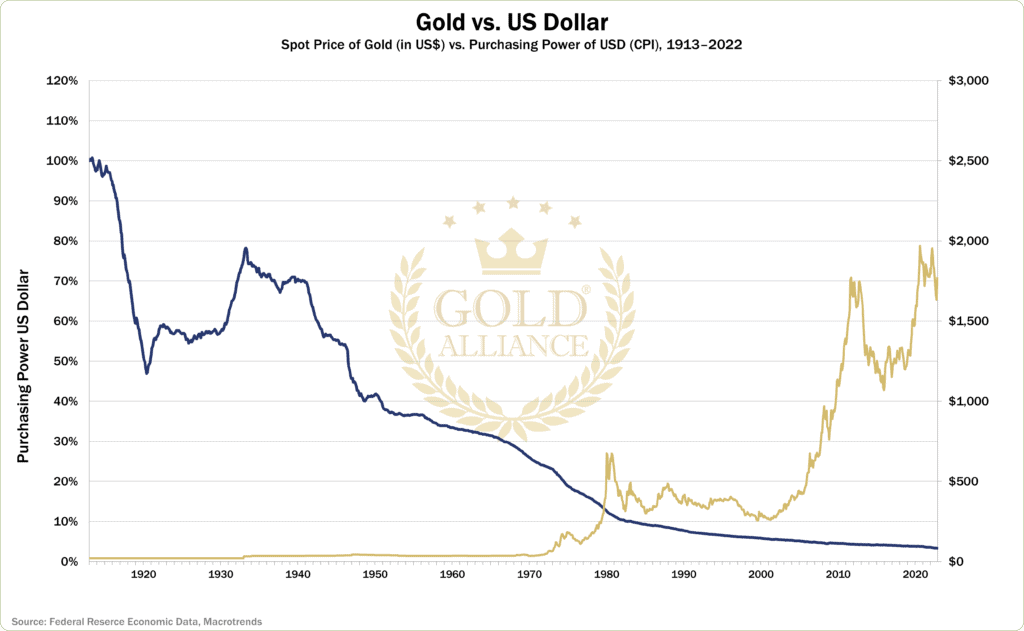
The black line represents more than a century of the US dollar’s purchasing power. And the orange line represents the purchasing power of gold.
If you weren’t aware of this stark contrast between the two assets, you’re not alone.
The Fed’s chart of the US Dollar’s decline “makes the rounds” in the news every so often. Then the latest news cycle captures the public’s eye, and the truth is “buried” for a moment.
Now, here we are again. And the question is: why is the news touting the dollar’s “strength” when it’s clearly losing purchasing power?
The answer is simple:
Over the last year, the Fed has tried to douse the flames of inflation by raising interest rates seven times. And these higher interest rates typically make historically “safe” investible financial products, like US government bonds, more attractive for foreign investors.
As a result, investors worldwide have been selling their weakening currencies for “stronger” US dollars. They’ve poured billions of their fresh dollars into higher-yield products. And this global surge in demand helped to push the dollar’s value up on the Fed’s “dollar index”.
This looks fantastic on paper. And it makes for hopeful news headlines.
But here’s the truth behind the scenes:
The US dollar is only “strong” compared to other global currencies. And the uptick in the dollar index only serves to bolster the dollar’s value as an investment vehicle. Not as a currency to buy goods and services.
With that in mind, let’s take a second look at the official St. Louis Fed chart of the dollar’s purchasing power since 1913 and the Fed’s money printing since 1959 (which is as far back as their data goes):
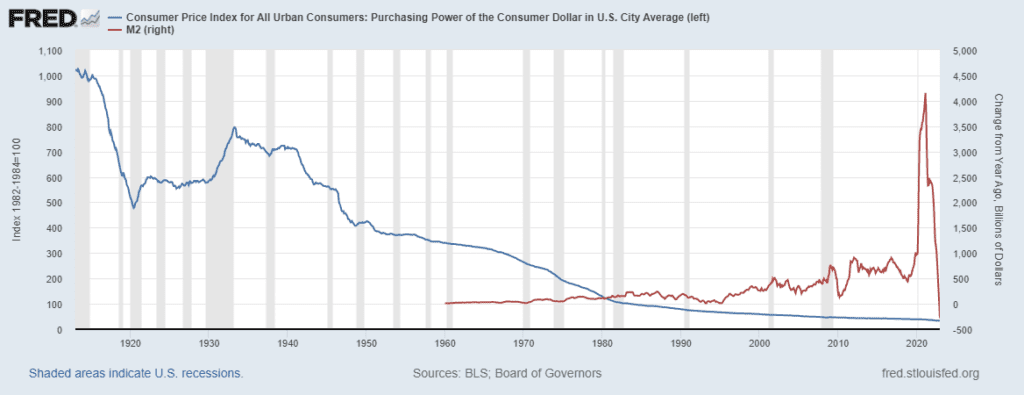
As you can see, the US dollar has lost nearly all its purchasing power since the Fed was set up in 1913.
This is what happens as the Fed prints money at a breakneck pace. New dollars flood the system. Inflation soars. And for every new dollar printed, the purchasing power of every dollar in your wallet goes down.
Meanwhile, incredible, physical, pure, unprintable gold is gaining in value.
And it has protected purchasing power for more than a century.
This is why it pays to peer behind the media curtain. See the truth with our own eyes. And give “King Gold” a close look in times of economic uncertainty.
Bottom line:
It may be wise to consider what may happen with the US dollar and gold going forward. And if your savings are still tied to dollars, you may also want to consider diversifying into gold now.
Because in the words of sage bard William Shakespeare:
“Better three hours too soon than a minute late.”
——————–
Want to know more about diversifying with gold? Click here to get a FREE Gold Information Kit. Or dial Toll-Free 888-529-0399 to speak with a friendly Gold IRA Specialist now. There’s no obligation.
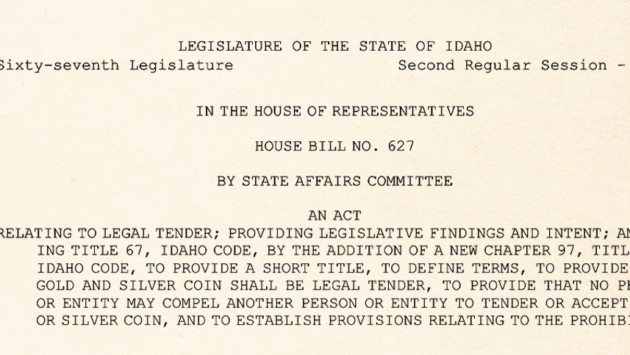
Radical Sound Money Movement Gains Traction in Most US States