At Gold Alliance, we are committed to educating our clients about precious-metals market trends that could impact their life savings.
That’s why we make it so easy to track the performance of the gold ounce price and other precious metals with our price charts. Click on our detailed interactive charting tool to view their performance over time. You can choose from our palladium, platinum, silver, and gold price charts. See gold ounce price right now:
Gold Ounce Price Calculator
Note: The spot prices of precious metals in this chart reflect the prices of the raw commodities, not the price of any product like a coin or a bar. And as such, the spot price is not representative of the prices Gold Alliance sells its products for or repurchases them for from its clients.
How does the relationship between inflation and market confidence affect gold ounce price?
But investors will be investors, and historically in times of financial uncertainty, investors have flocked to gold. When the Great Recession hit, for instance, gold prices increased many times over. As the stock market bottomed out, gold was valued at $700 an ounce, and then for over 2.5 years, it kept rising even as the economy started to recover. The price of gold climbed to $1,825 in 2011 with the cheapest physical gold products at $1,950.
How does the gold supply affect gold ounce price?
Aside from the fact that the number of people wanting to buy gold is increasing at an even faster rate than the supply of gold, due to the increase in population, jewelry and investment demand offer additional foundations to the potential rise in the gold ounce price.
For investors, gold is typically held for a very long time after purchase. It’s highly unusual to invest in gold and then quickly sell it. The class of gold day-traders is very small. The same goes for gold jewelry (people are more likely to put it in a drawer or pass it down to a family member than cashing it in for a new TV. This means that new demand for gold has to be satisfied to a large extent from newly mined gold, and there just isn’t enough to go around when demand hits.
What role do central banks play in gold price per ounce?
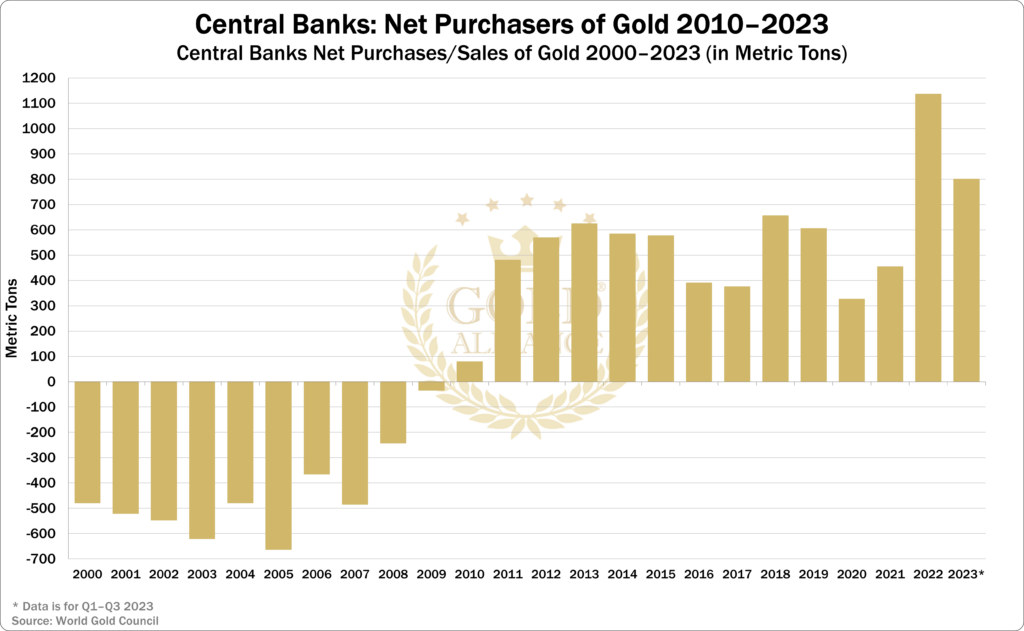
Central banks are a major factor when gold prices are decreasing. During times when foreign exchange reserves are large and the economy is buzzing along, which means that growth for gold is low, a central bank will sometimes decide to exchange a portion of the gold it holds for a higher-growth asset. At the end of the day, central banks are businesses that are expected to make a profit.
The problem they face is that this is exactly when gold demand is not at its peak. Central banks are, not surprisingly, aware of this fact, so they take careful steps to manage their gold sales in a manner to maximize their portfolios or the markets. In fact, in an agreement between leading central banks called The Washington Agreement, the central banks agreed that no central bank will sell more than 400 metric tons of gold in a year. Signed on September 26, 1999, by 13 nations, this agreement is highly respected between the parties involved, and it was strengthened in 2004 and extended in 2009. However, the agreement was not renewed in 2019, as central banks are shifting away from selling gold to buying it.
What is the spot price of Gold per ounce today?
The price of gold constantly changes live throughout standard trading hours, just like any other commodity. Gold Alliance lists live Gold prices as well as historical data related to Gold spot price. All prices are updated in real-time and available at the top of every Gold Alliance page on our website.